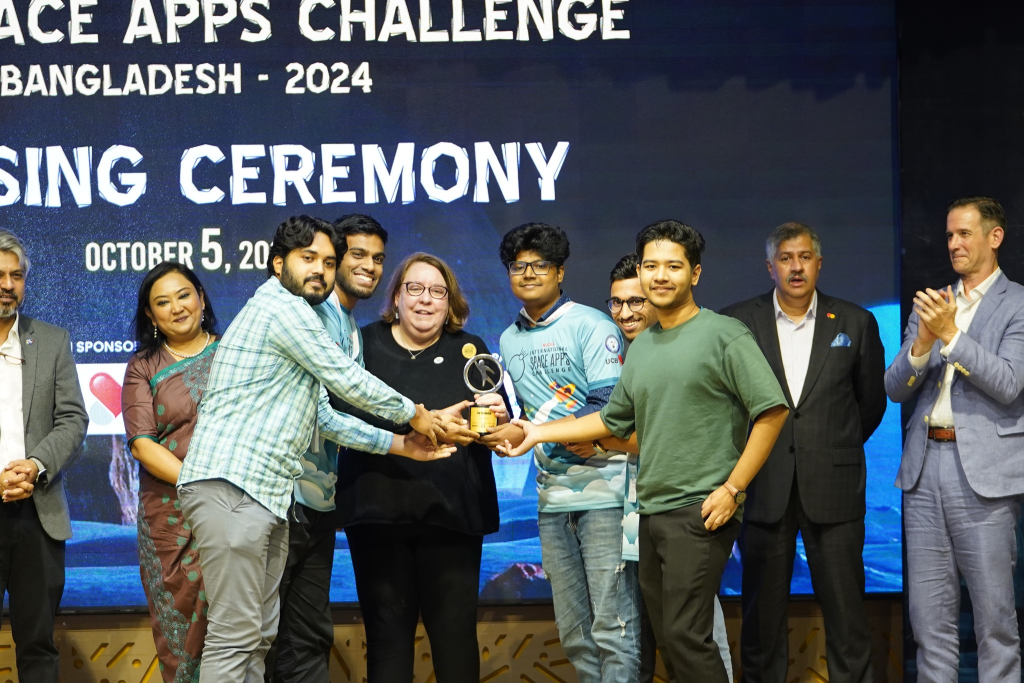
We became the Dhaka Division Champions of the NASA Space Apps Challenge 2024!

I’m so proud of what our team achieved—from our initial ideas to becoming champions. This was the most exciting and challenging hackathon I’ve ever joined, and every member of my team worked hard and showed great creativity to make our vision come true.
About a month ago, we formed our team and started working on the challenge, focusing on the Landsat Reflectance Data category. It was a complex topic, but we believed we could create a better management and visualization tool using NASA’s Landsat data. As a team, we’ve always been fascinated by working with maps, so this challenge felt like the perfect fit.
In the preliminary online round, we submitted a video explaining our problem statement, solution, and the impact—all illustrated through Figma layouts. After passing that stage, we moved on to onsite participation and started bringing our idea to life through coding and tech.
We had to learn a lot—like how Landsat satellites orbit, TLE data, spectral bands such as Short-Wave IR, NDVI, Color IR, and indexes like Water Index, Surface Temp Index, and Moisture Index. We also built tools to visualize user-selected regions and alert them about upcoming Landsat overpasses. We even added a feature to validate Landsat data with ground measurements by authorized users.
We developed Landsat Pulse, a web and mobile app designed to simplify access to Landsat satellite data. Traditionally, users must download full satellite blocks and use complex GIS software, even for small areas, and they often don’t know when the satellite will pass or when the latest data will be available. Landsat Pulse addresses these issues by allowing users to create targeted land plots, view and analyze specific data, and set custom notifications for satellite passes and data availability. It also supports IoT device automation and ground sensor data validation, enabling easy comparison with Landsat data. Additionally, the app offers AI-powered prediction tools to assess future calamities. With a user-friendly interface and advanced features, Landsat Pulse makes satellite data analysis accessible to beginners and professionals alike. The project has the potential to evolve into a global platform for real-time environmental monitoring, empowering citizens, scientists, and decision-makers to protect the planet and foster a sustainable future.
What Exactly Does It Do?
1. Target Area creation:
- Users can define their target location through multiple methods:
- Interactive map selection (placing a pin)
- Entering latitude and longitude coordinates
- Searching for a place name
- Save the geojson data on database. Load the geojson data and analyze the data of that area.
2. Live LandSat tracking:
- Tracking Landsat8 and Landsat9 through TLE data.
- Also display cycle and paths for different days.
- Visualize those tracking data in 3D and 2D view.
3D View:

2D View:

3. Real-Time Overpass Notifications:
- The application sends alerts to users about upcoming Landsat satellite overpasses at their specified locations.

- Users can customize notification lead times (e.g., 1 hour, 1 day) and choose notification channels (SMS, email, Slack).

- Set webhook to activate IOT devices, and trigger through notification.
4. Data Visualization:
- 3×3 Pixel Grid: Users can view a grid of Landsat pixels centered on their selected location, enabling easy comparison of surface reflectance data.


- Extract different bands of data from the imported geojson.
- Visualize block by path and row (WRS-2).

- Time-lapse Analysis: The application supports time-lapse visualizations of environmental changes, helping users track trends over time.
- Environmental Trends: Users can analyze changes like deforestation, flooding, or urban development using overlays such as NDVI and false-color imagery.


6. Integration of RAG Technology:
- Users can generate contextual insights by leveraging GPT-powered Retrieval-Augmented Generation technology, which pulls relevant external data and historical reports for deeper analysis.

7. Access to Surface Reflectance Data:
- Users can access detailed Surface Reflectance data, including surface temperature and various spectral bands.
- The app provides metadata for each Landsat scene, including acquisition date, time, satellite, cloud cover percentage, and image quality.
8. Data Export, Comparison and Sharing:
- Users can analyze ground data with Landsat-acquired data for validation.
- Users can download data in formats like CSV for further analysis or share insights directly from the app via social media or email.
9. Mobile App:


How Does It Work?
1. User Interface:
- The front end is built using NEXT.JS to create a dynamic, user-friendly interface. Users interact with the map, enter location details, and receive notifications through intuitive forms and menus.
2. Backend Processing:
- The backend is developed using Node.js and Python Flask, managing API requests to retrieve Landsat data, calculate overpass timings, and send notifications.
3. Data Retrieval:
- The application integrates with the USGS Landsat APIs to access Surface Reflectance data and scene metadata. Algorithms compute the timing of satellite overpasses based on orbital mechanics.
4. Real-Time Notifications:
- A notification service (e.g., Firebase for SMS or SendGrid for emails) is employed to ensure users receive timely alerts regarding satellite passes.
5. Data Visualization:
- Mapping libraries like Leaflet are used to display spatial data, including pixel grids and satellite paths, on the interactive map.
After all that coding, building, and implementation, last Friday the onsite round took place at AIUB campus. I must say AIUB has a very nice campus. Everything felt premium, professional, and corporate xd. On the final day, we worked less on the coding side and focused more on the presenting side, making a 4-minute and a 30-second video. Sadly, our team had no female member, and we were told we might lose 5% of our mark because of it. We tried our best to include a female member as we had 1 slot left, but after consulting our mentor, we found out we couldn’t do that now. However, we did our best. Our mentor was really great—she helped us make a professional and standard presentation. We are really grateful to her.
In the final prize-giving ceremony, we were sure we might get a prize but also skeptical because Dhaka Division has the toughest competition with so many strong teams. And we already lost 5% of our mark for not having a female member. When they announced the 2nd and 1st runner-ups, I lost hope, but a part of my heart kept repeating, ‘Quantum, Quantum, Quantum…’ Then they announced: Quantum Voyagers as the Champions of Dhaka Division! I screamed like crazy, clenched my teeth so hard I thought my brain might explode. It was just an insanely amazing experience.
Afterwards, we connected with some prominent figures in the field, gaining valuable guidance for future rounds of NASA Space Apps Challenge. Our next goal is to get shortlisted globally and, hopefully, become the world champions in 2024. Wish us luck!
Huge thanks to all my teammates—I’m proud to be part of this best ever team in the universe.
Our Project: https://github.com/JHM69/landsat-pulse-app
On NASA Space Apps: https://www.spaceappschallenge.org/…/quantum-voyagers/…


